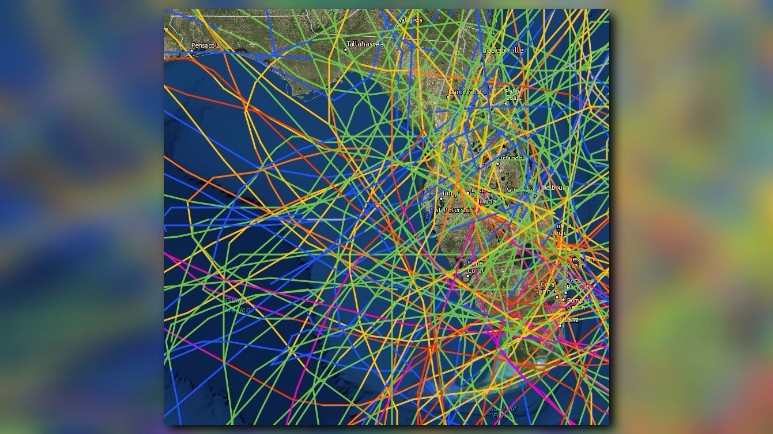
Hurricanes and tropical storms have crisscrossed Florida since long before tracking maps, spaghetti plots and cones of uncertainty entered our vocabulary.
The National Oceanic and Atmospheric Administration (NOAA) maintains an extensive archive of hurricane data, and one interactive map allows users to chart storms that have impacted a city, county, region or state. Different colors represent different storm strengths.
Florida's interactive, color-coded chart looks like somebody spilled a set of Pick-Up Sticks across a state map. It's that congested.
Below are a series of images showing color-coded, hurricane tracking lines superimposed over a Florida map. It includes all tropical storms and hurricanes that made landfall in Florida for the past 100 years, through 2015.
Image below: Category 5 hurricanes
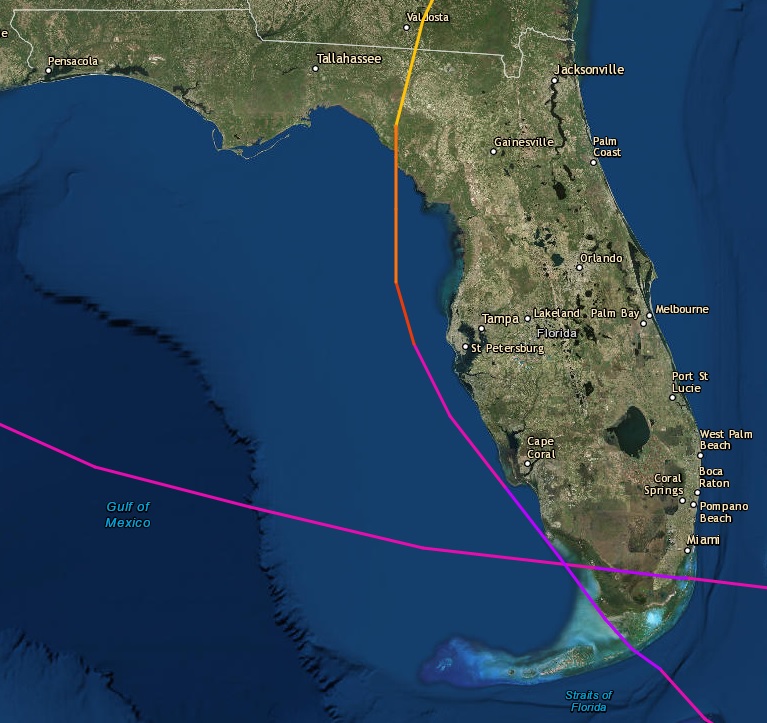
Image below: Category 4 hurricanes and stronger
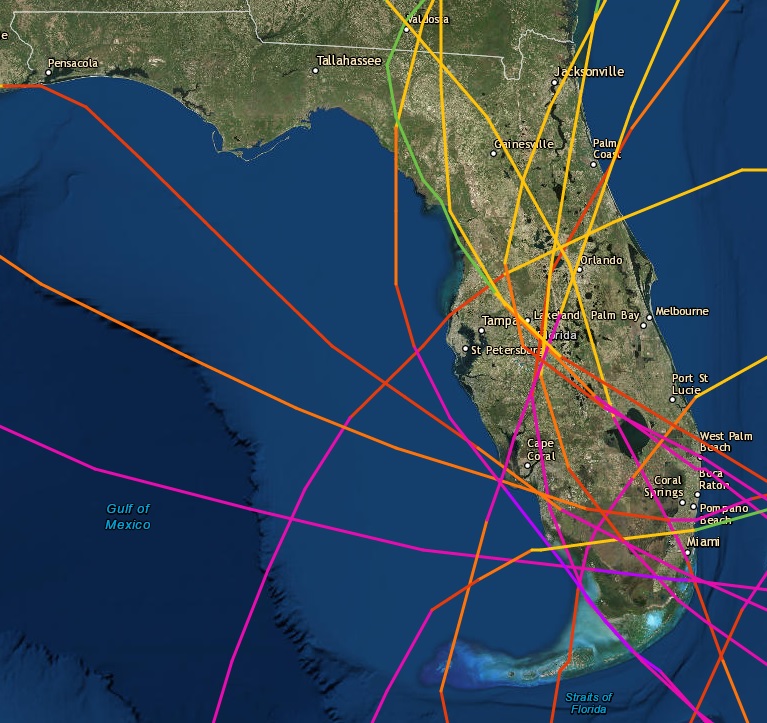
Image below: Category 3 hurricanes and stronger
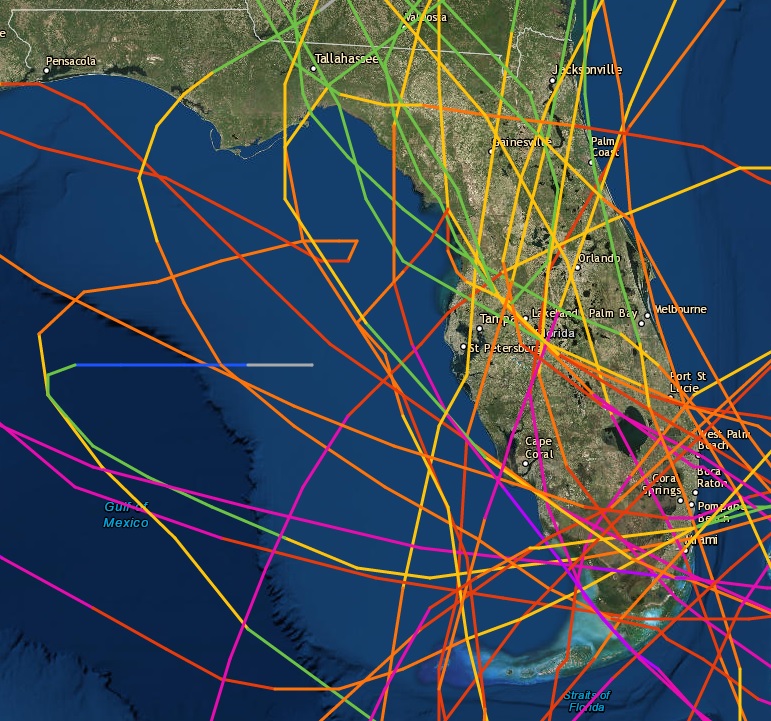
Image below: Category 1 hurricanes and stronger
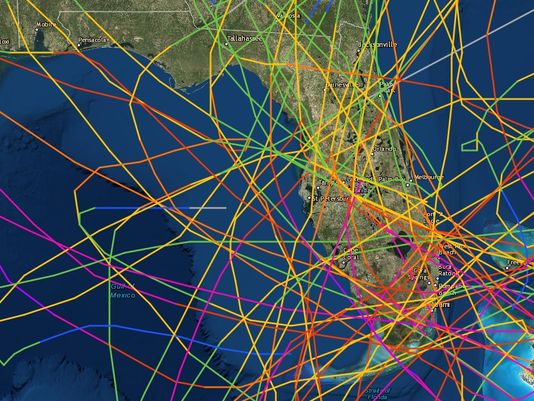
Image below: Tropical storms and stronger
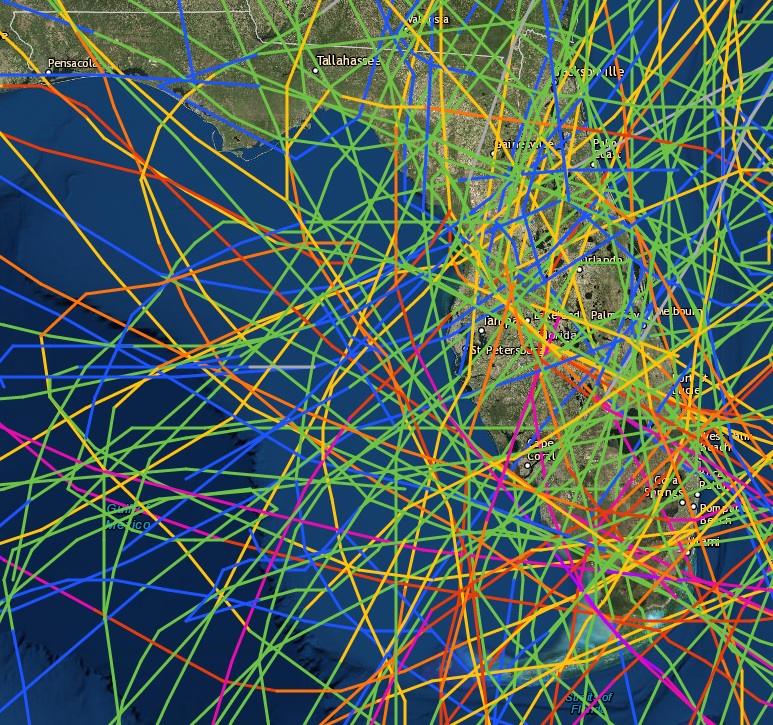
It's hard to see, but yes, the Florida map still is pictured in the image directly above. All 67 counties have been hit by tropical systems on multiple occasions during the past 100 years, so there is no safe haven in the Sunshine State.
At least, not until January. In the past century, only three months — January, March and April — failed to register at least one land-falling tropical storm or hurricane in Florida.
Twenty-eight major hurricanes, which are Category 3, 4 or 5 (111 mph winds or stronger), have made landfall in Florida since 1916.
Follow Dave Breitenstein on Twitter: @D_Breitenstein

