If states like Georgia are reopening, then that must mean COVID-19 cases are going down for those areas, right?
That may not necessarily be true for the Peach State.
Gov. Brian Kemp has reopened the state on April 24, citing a downward trend of COVID-19 cases being reported by the Georgia Department of Health. Georgians have been relying on this data (number of cases, hospitalizations and deaths in their areas) to determine whether or not it's safe for them to go out.
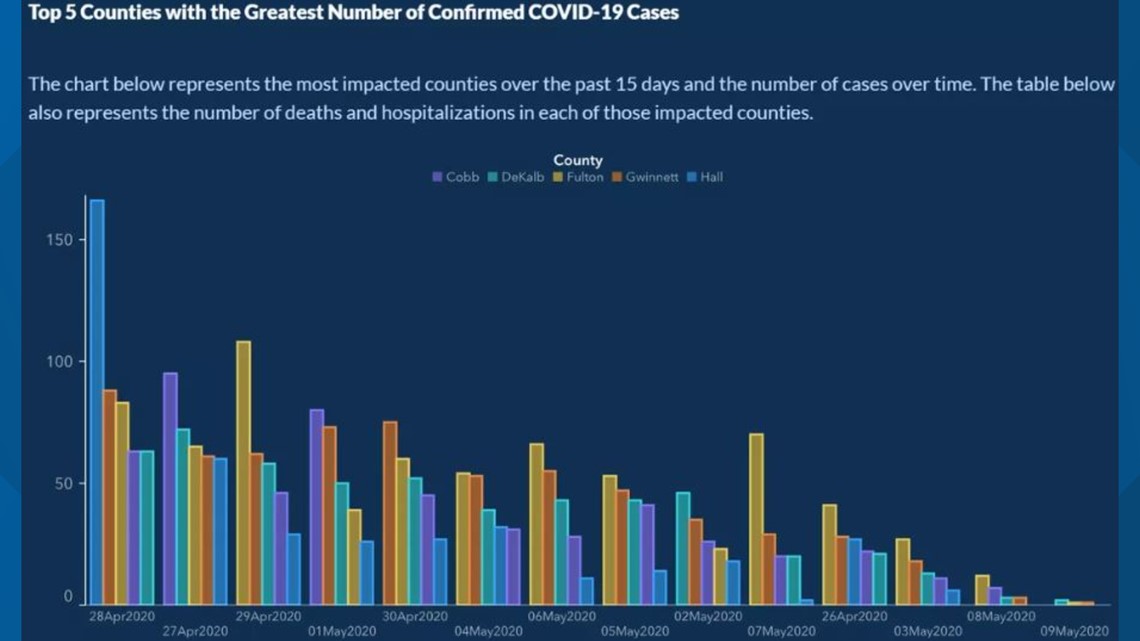
Recently, however, the department released a graph (below) that showed the top five Georgia counties with the greatest number of cases of coronavirus from April 28 to May 9. However, it had to retract the graph because it was misleading, according to the Atlantic Journal Constitution.
At first glance, the graph appears to show a steady decline in cases for the counties. However, looking closely, the dates are not in chronological order. Instead, it is organized by the highest number of cases on the left to the lowest number of cases on the right, despite the date.

- April 28
- April 27
- April 29
- May 1
- April 30
- May 4
- May 6
- May 5
- May 2
- May 7
- April 26
- May 3
- May 8
- May 9
This error gained national attention and even resulted in the governor issuing an apology to the public.
“We are not selecting data and telling them how to portray it, although we do provide information about constituent complaints, check it for accuracy, and push them to provide more information if it is possible to do so,” Kemp’s communications director Candice Broce told the Journal-Constitution.
Even so, Georgia has previously struggled at reporting accurate data during the coronavirus pandemic when compared to the numbers documented by the Centers for Disease Control and Prevention, according to the Atlantic Journal Constitution.
To help make cases more clear, the Department of Health created a new graph that shows the "14-day window," which is based on the number of days it can take for symptoms from COVID-19 to appear.
Still, First Coast News is on your side analyzing our own data and building our own charts to give you an independent view of what is happening.
There have been 38,721 cases confirmed by the Department of Health, as of May 19. Based on the numbers recorded by First Coast News and our Atlanta station, WXIA-TV, numbers are not necessarily going down but remaining steady.

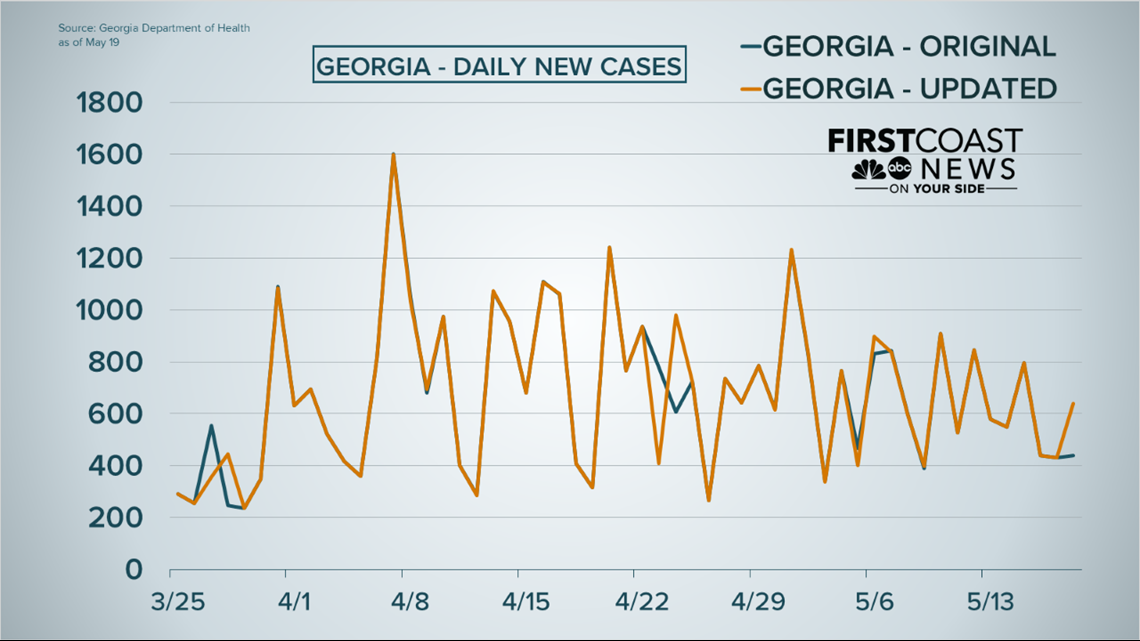
In a new chart above, the updated number is represented by the orange number whereas the green line represents past numbers reported.
Two major discrepancies appear to be around April 22 to April 24 (day of reopening) where the department initially reported a drop in new cases from nearly 900 to around 600 cases, and back up to about 700 cases. In reality, the state saw a significant drop from about 900 cases to around 400 cases, then a spike back to nearly 1,000 cases before another significant drop, according to the numbers documented by the Department of Health's website.

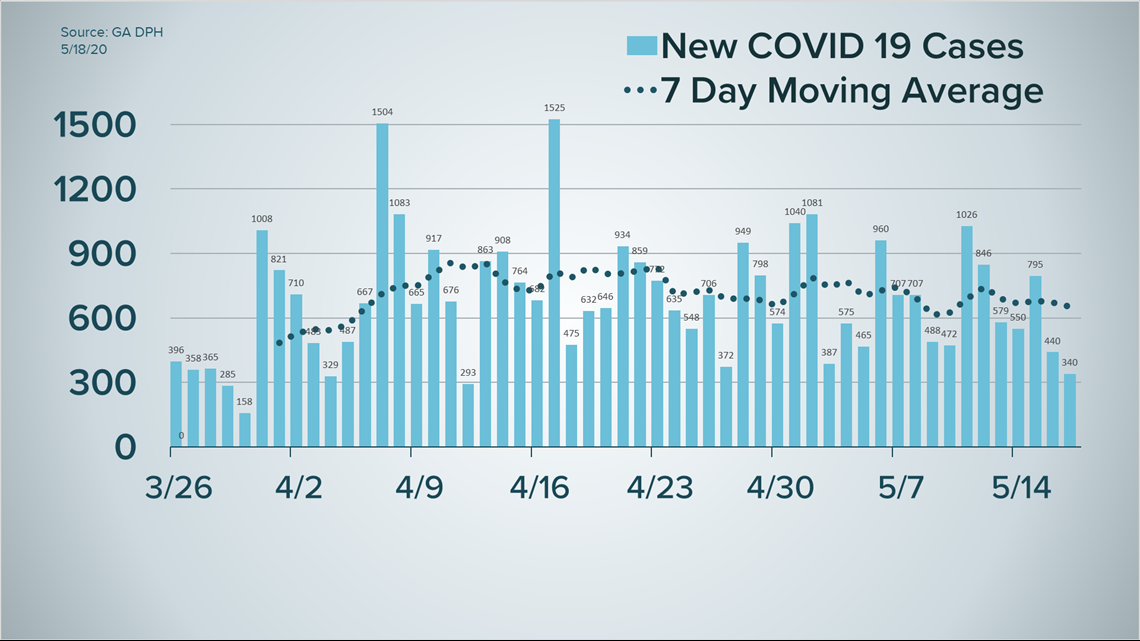
The average, however, shows that the cases still average fairly flat over the past seven days. But on May 11, a lot of new cases were reported.
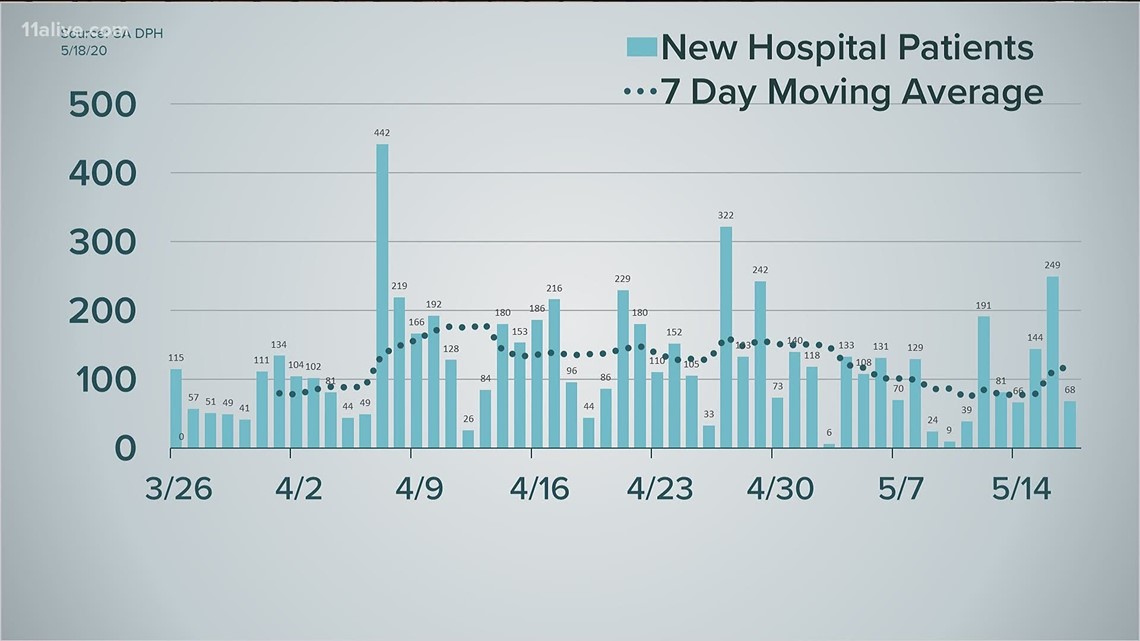
The chart below uses a seven-day average of hospitalization to show the moving trend of these numbers.

To be more transparent, the Department of Health's website notes that its reporting may be incomplete "due to illnesses yet to be reported or test results may still be pending."

