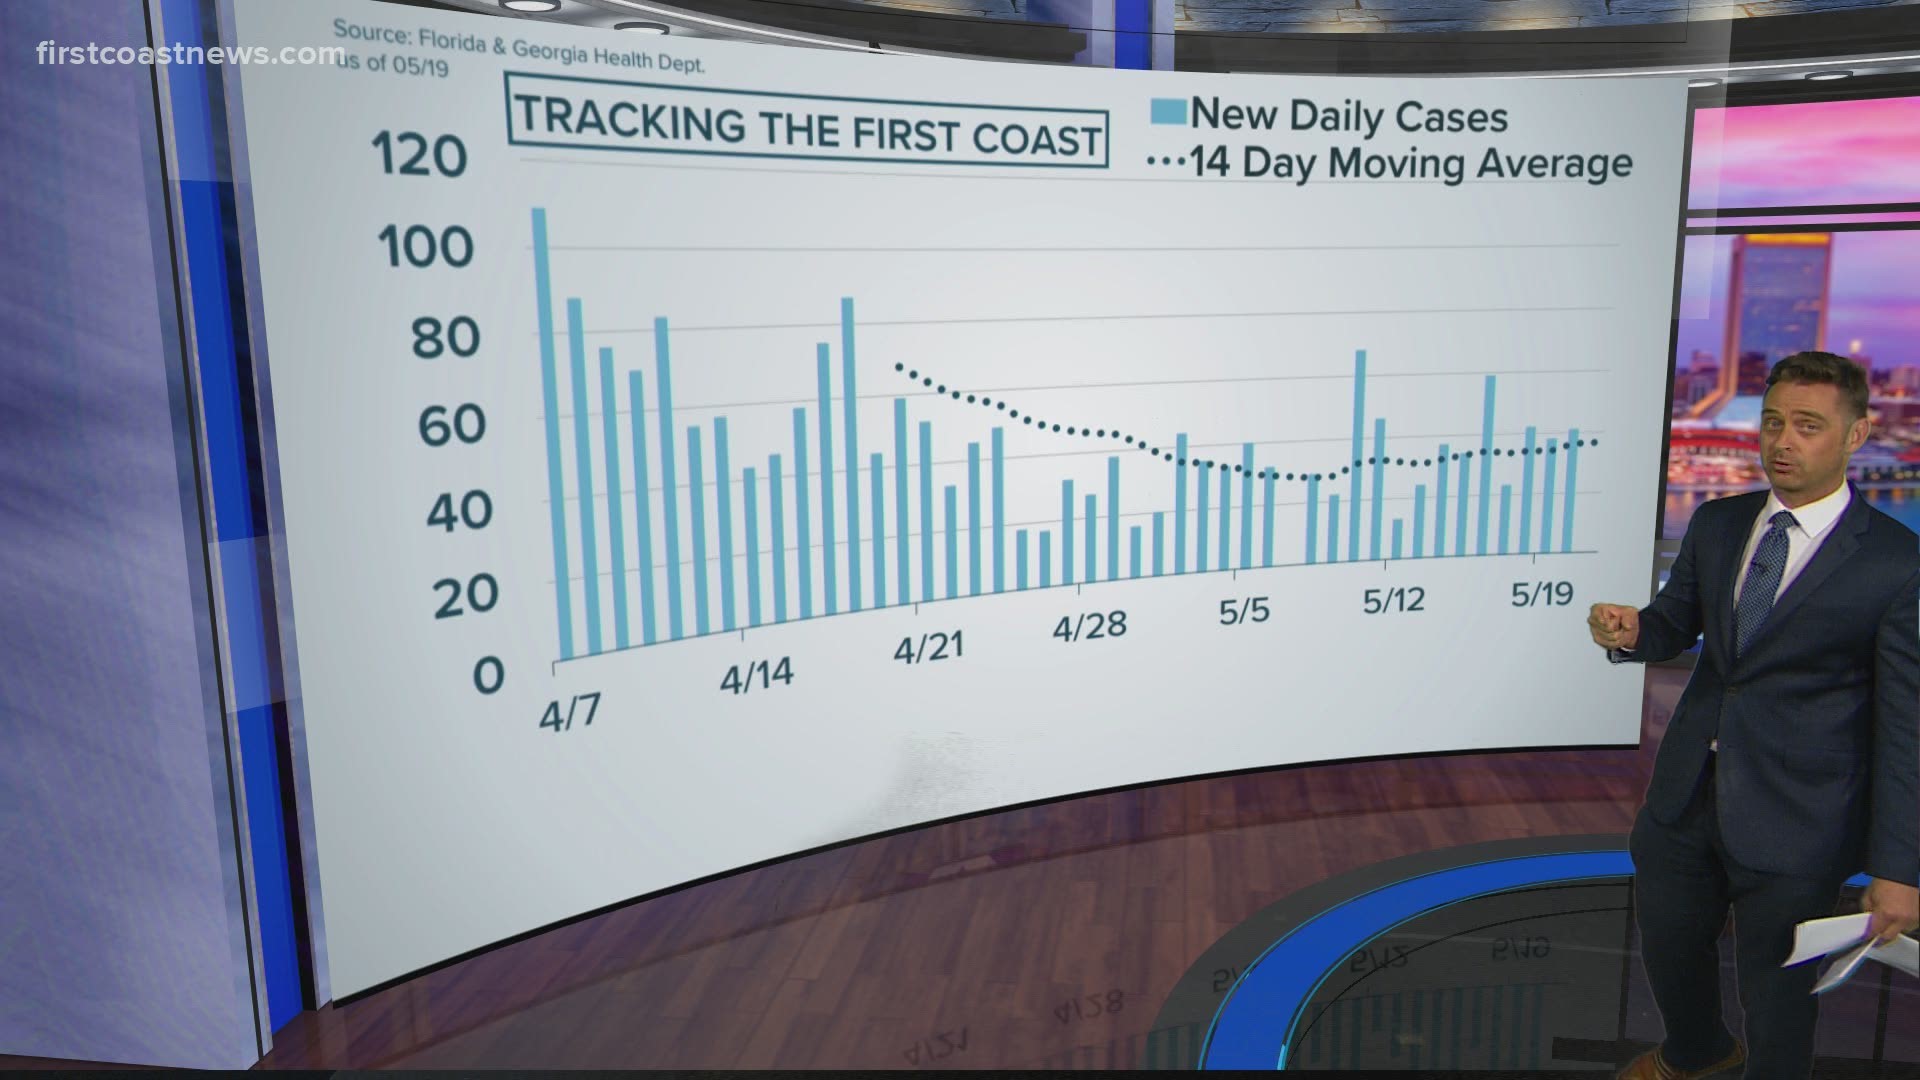
JACKSONVILLE, Fla. — First Coast News is putting the curve of new COVID-19 cases into context, from new cases in Florida and Georgia to the percentage of positive tests compared to the total number of people tested for the novel coronavirus.
Duval County Daily New Cases:
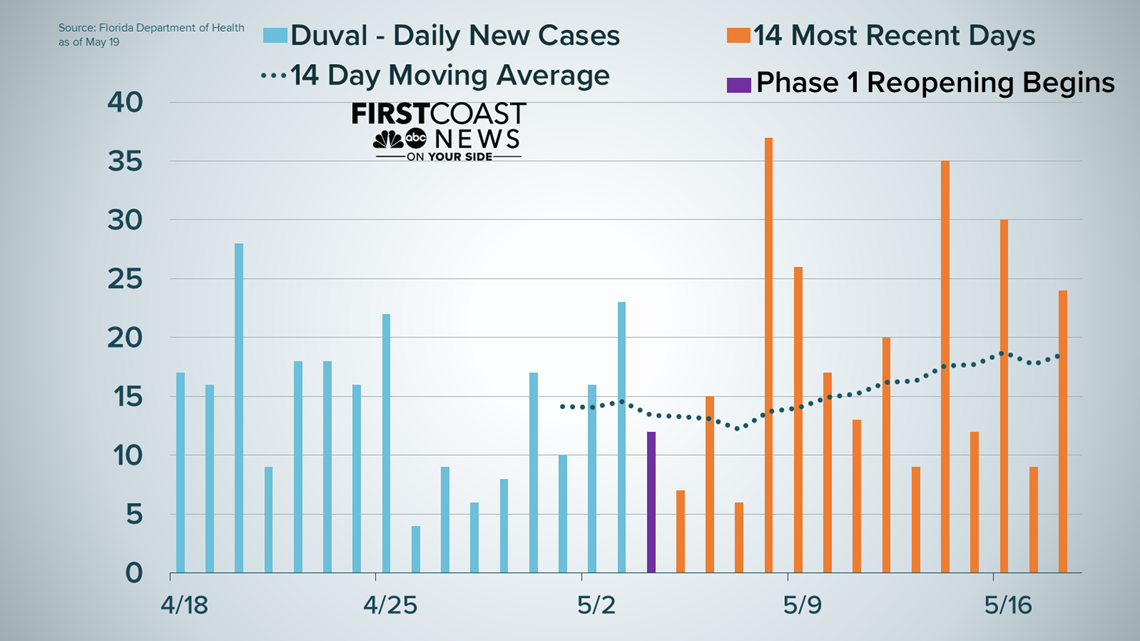
This graph shows the number of new cases each day in Duval County over the past month. The purple bar shows when Phase 1 of reopening began on May 4.
You can see the curve leveled off the first week of May, but take a look at the orange bars. You can see the curve starting to go up over the past 14 days.


Florida, Duval County Percent Positive Cases:
This graph focuses on the percentage of people testing positive for COVID-19 over the past six weeks.
Florida's numbers are in green. The percent positive currently at 3.5%.
Duval County's numbers are in orange. The percent of positive cases is currently at 1.6%.
Both sets of data have been trending down since early April. Both are well below the 10% target range.
Officials say we need to stay below 10% to allow the reopening process to progress.


Florida Daily New Cases:
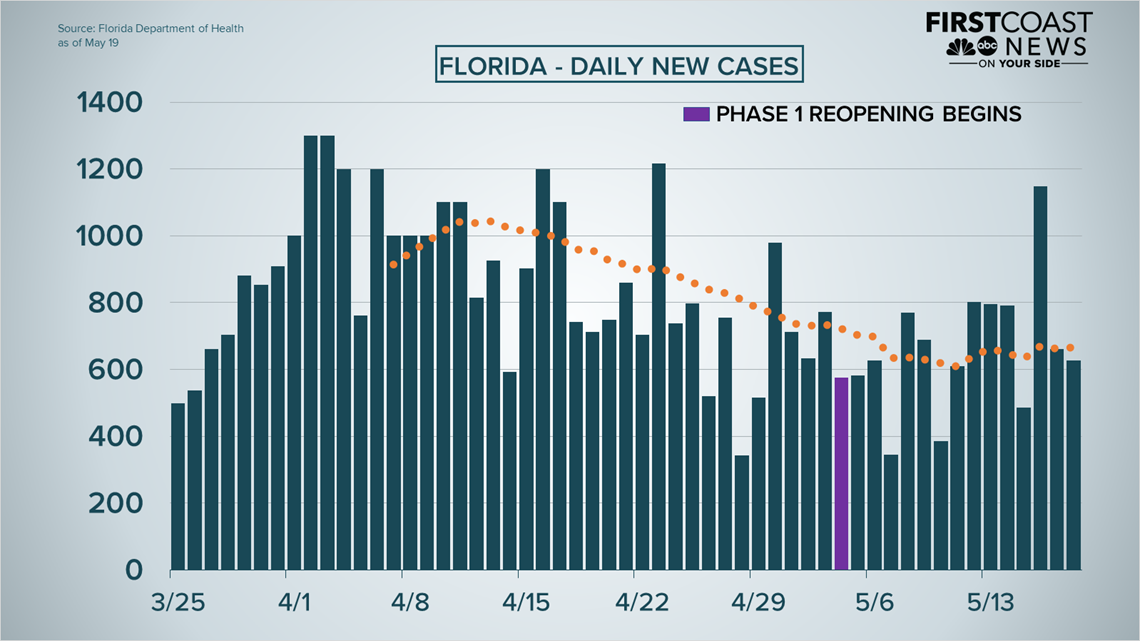
Statewide, the number of daily new cases started dipping after the first week of April. But, the curve has mostly flattened over the past two weeks, since Phase 1 reopening began, shown in purple.


Georgia Daily New Cases:
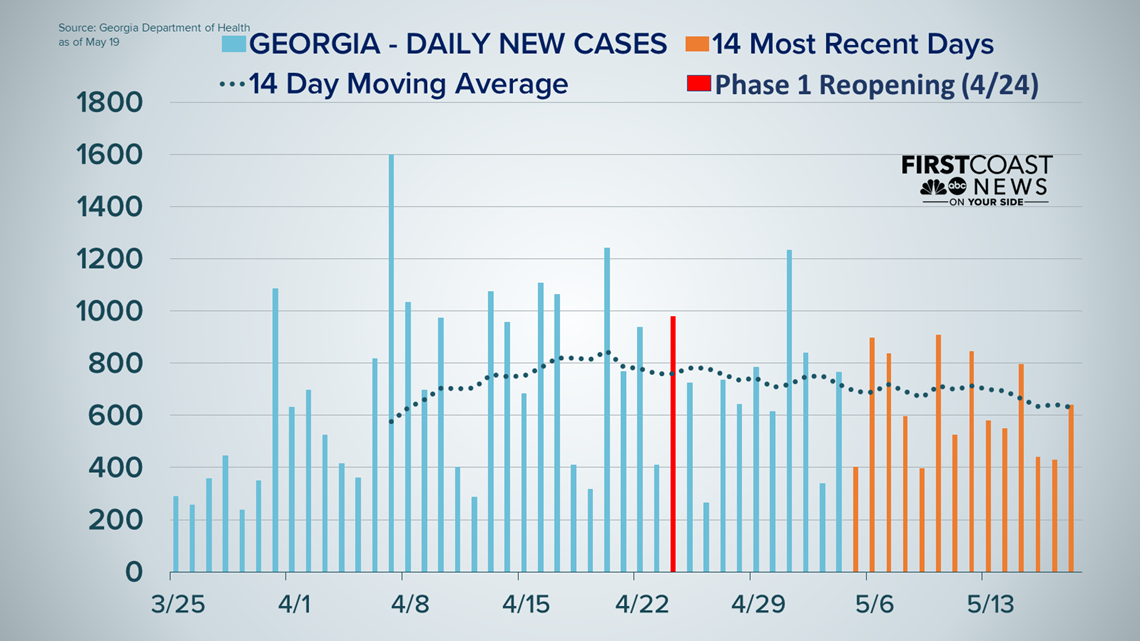
This graph shows the number of new cases each day in Georgia since late March. The cases peaked after the first week of April.
The overall curve trends slightly downward over the past few weeks since Phase 1 reopening began April 24, shown by the red bar.


